Development/GDB
| Navigation: bwHPC BPR |
|---|
Debugging
The GNU Debugger (GDB) is a standard debugger for serial programs although it can be used for parallel and even distributed programs with few processes too. The Intel Debugger (IDB) uses the same commands for basic debugging as GDB and hence can be used instead of GDB just by substituting idbc for gdb.
Loading
There is no need for loading GDB because it is available by default. If you want to use IDB load the Intel compiler module:
$ module load compiler/intel
Documentation
Online documentation: GDB documentation and IDB Documentation
Local documentation: For detailed lists of the different program options consult the man page:
$ man gdb
or
$ man idb
Basic commands
The code you want to debug should be compiled with the -g option and it is recommended that optimization flags are not set. To start a debug session for a program execute GDB with the program path as parameter:
$ gdb ./example
Inside GDB is a prompt where you can enter commands. Important commands are listed below.
| Command | Description |
|---|---|
| help cmd | Show help for command cmd. |
| break func | Set a breakpoint at function func. |
| run | Start program. |
| next | Go to next program line. Do not enter functions. |
| step | Go to next program line. Enter functions. |
| list | Show the surrounding source code of the currently processed line. |
| print expr | Print the value of the expression expr. |
| display expr | Display the value of the expression expr every time the program stops. |
| watch expr | Stop when value of the expression expr changes. |
| continue | Continue execution until a breakpoint or a watchpoint appears. |
| quit | Exit GDB. |
Example: We debug the following program called bug.c which crashes on execution.
#include <stdio.h>

int global = 0;

void begin() {
    global = 1;
}

void loop() {
    int v[2];
    int i, k;

    for(i = 0; i < 8; i++) {
        k = i/2*2;	/* should have been k = i/(2*2); */
        v[k] = i;
    }
}

void end() {
    global = 2;
}

int main() {
    begin();
    loop();
    end();

    return 0;
}
Sample GDB session:
$ gcc -g bug.c -o bug
$ gdb ./bug
GNU gdb (GDB) Red Hat Enterprise Linux (7.2-60.el6_4.1)
Copyright (C) 2010 Free Software Foundation, Inc.
License GPLv3+: GNU GPL version 3 or later <http://gnu.org/licenses/gpl.html>
This is free software: you are free to change and redistribute it.
There is NO WARRANTY, to the extent permitted by law.  Type "show copying"
and "show warranty" for details.
This GDB was configured as "x86_64-redhat-linux-gnu".
For bug reporting instructions, please see:
<http://www.gnu.org/software/gdb/bugs/>...
Reading symbols from /pfs/data2/home/xx/xxx/xxxx/bug...done.
(gdb) break main
Breakpoint 1 at 0x4005b2: file bug.c, line 26.
(gdb) run
Starting program: /pfs/data2/home/xx/xxx/xxxx/bug

Breakpoint 1, main () at bug.c:26
26              begin();
Missing separate debuginfos, use: debuginfo-install glibc-2.12-1.132.el6.x86_64 libgcc-4.4.7-4.el6.x86_64
(gdb) next
27              loop();
(gdb) next

Program received signal SIGSEGV, Segmentation fault.
0x0000000000000005 in ?? ()
(gdb) # now we know that the bug is in loop(). start again.
(gdb) run
The program being debugged has been started already.
Start it from the beginning? (y or n) y
Starting program: /pfs/data2/home/xx/xxx/xxxx/bug

Breakpoint 1, main () at bug.c:26
26              begin();
(gdb) next
27              loop();
(gdb) step
loop () at bug.c:13
13              for(i = 0; i < 8; i++)
(gdb) next
15                      k = i/2*2;
(gdb) next
16                      v[k] = i;
(gdb) # maybe k gets too big?
(gdb) watch (k >= 2)
Hardware watchpoint 2: (k >= 2)
(gdb) continue
Continuing.
Hardware watchpoint 2: (k >= 2)

Old value = 0
New value = 1
loop () at bug.c:16
16                      v[k] = i;
(gdb) # k is too big
(gdb) print k
$1 = 2
(gdb) print i
$2 = 2
(gdb) quit
Multithreaded debugging
GDB can also be useful for multithreaded applications for example when OpenMP was used. By going through each thread separately you can better see what is really going on and you can check the computation step by step. The following commands are useful for multithreaded debugging:
| Command | Description |
|---|---|
| info threads | Shows the status of all existing threads. |
| thread num | Switches to the thread with the number num |
Parallel Debugger ddt
Currently only for employees of KIT
|
On bwUniCluster the GUI based distributed debugging tool (ddt) may be used to debug serial as
well as parallel applications. For serial applications also the GNU gdb or Intel idb debugger may be used. The Intel idb comes with the compiler and information on this tool is available together with the compiler documentation. In order to debug your program it must be compiled and linked using the -g compiler option. This will force the compiler to add additional information to the object code which is used by the debugger at runtime. |
ddt consists of a graphical frontend and a backend serial debugger which controls the application program. One instance of the serial debugger controls one MPI process. Via the frontend the user interacts with the debugger to select the program that will be debugged, to specify different options and to monitor the execution of the program. Debugging commands may be sent to one, all or a subset of the MPI processes.
Before the parallel debugger ddt can be used, it is necessary to load the corresponding module file:
$ module use /opt/bwhpc/ka/modulefiles      (only available for employees of KIT)
$ module add debugger/ddt
Now ddt may be started with the command
$ ddt program
where program is the name of your program that you want to debug.
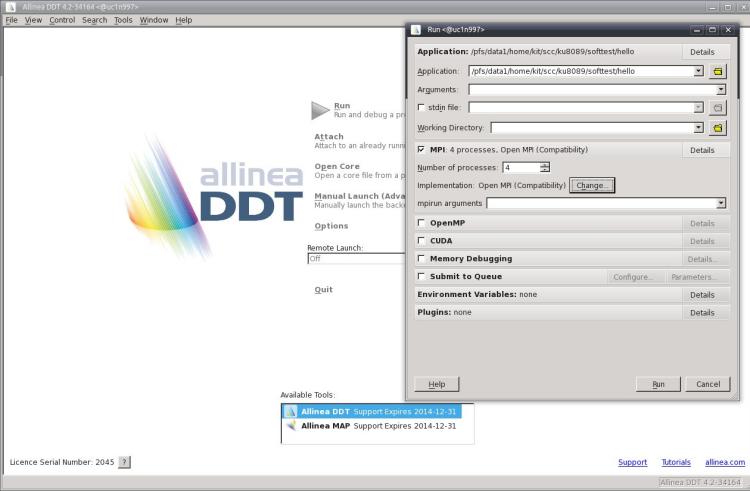
Figure: DDT startup window
The above figure shows ddt’s startup window. Before actually starting the debugging session you should check the contents of several fields in this window:
1. The top line shows the executable file that will be run under control of the debugger. In the following lines you may input some options that are passed to your program or to the MPI environment.
2. If your program reads data from stdin you can specify an input file in the startup window.
3. Before starting an MPI program you should check that "Open MPI (Compatability)" or "Intel MPI" is the MPI implementation that has been selected. If this is not the case, you have to change this. Otherwise ddt may not be able to run your program. In order to debug serial programs, the selected MPI implementation should be "none". You may also change the underlying serial debugger using the "change" button. By default ddt uses its own serial debugger, but it may also use the Intel idb debugger.
4. Select the number of MPI processes that will be started by ddt. If you are using ddt within a batch job, replace mpirun by ddt in the command line of ????? and make sure that the chosen number of MPI processes is identical to the number of MPI tasks (-p option ???) that you selected with the ?????? command. When you debug a serial program, select 1.
5. After you have checked all inputs in the ddt startup window, you can start the debugging session by pressing the "run" button.
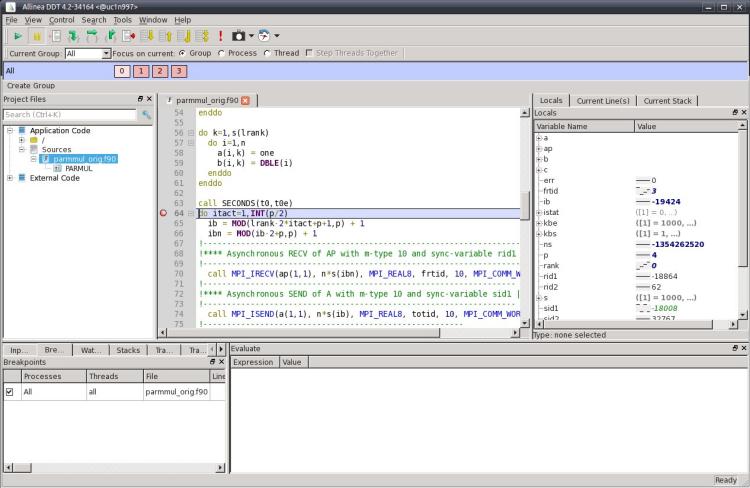
The ddt window now shows the source code of the program that is being debugged and breakpoints can be set by just pointing to the corresponding line and pressing the right
mouse button. So you may step through your program, display the values of variables
and arrays and look at the message queues.

