File:Fig resources vs queue time.jpg
Jump to navigation
Jump to search
Size of this preview: 800 × 181 pixels. Other resolution: 1,594 × 360 pixels.
Original file (1,594 × 360 pixels, file size: 35 KB, MIME type: image/jpeg)
Summary
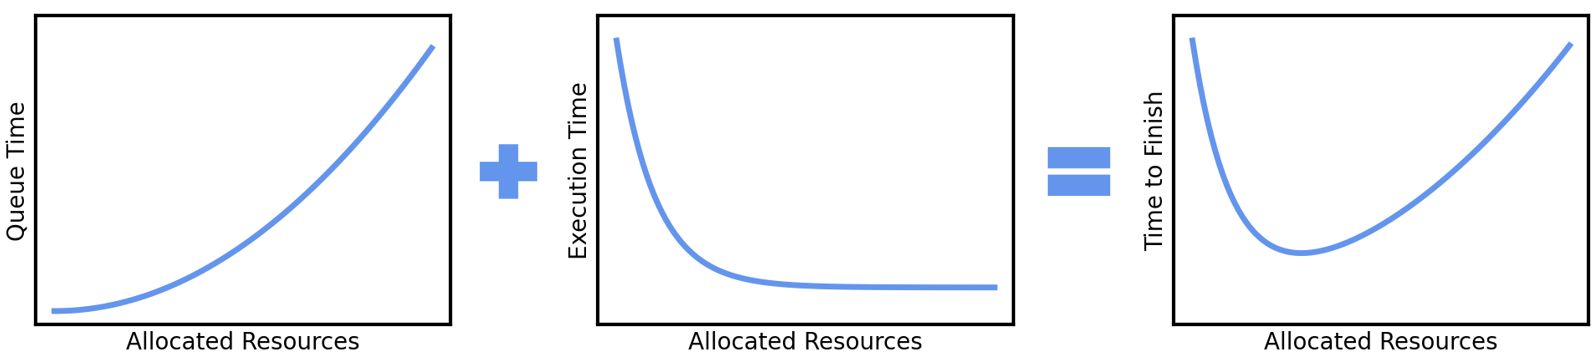
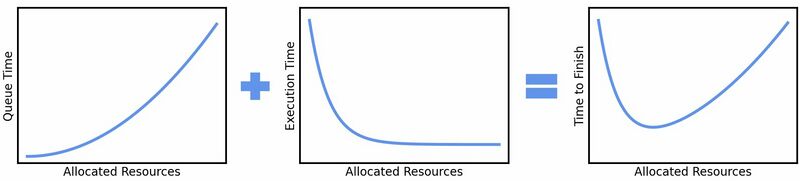
A figure illustrating that the queue time increases with increasing resources (e.g., CPU cores) while the execution time decreases with increasing resources.
File history
Click on a date/time to view the file as it appeared at that time.
| Date/Time | Thumbnail | Dimensions | User | Comment | |
|---|---|---|---|---|---|
| current | 11:19, 8 May 2023 | 1,594 × 360 (35 KB) | J Steuer (talk | contribs) | A figure illustrating that the queue time increases with increasing resources (e.g., CPU cores) while the execution time decreases with increasing resources. |
You cannot overwrite this file.
File usage
The following page uses this file: