Development/GDB
| Navigation: bwHPC BPR |
|---|
Parallel Debugger ddt
Currently only for employees of KIT
|
On bwUniCluster the GUI based distributed debugging tool (ddt) may be used to debug serial as
well as parallel applications. For serial applications also the GNU gdb or Intel idb debugger may be used. The Intel idb comes with the compiler and information on this tool is available together with the compiler documentation. In order to debug your program it must be compiled and linked using the -g compiler option. This will force the compiler to add additional information to the object code which is used by the debugger at runtime. |
ddt consists of a graphical frontend and a backend serial debugger which controls the application program. One instance of the serial debugger controls one MPI process. Via the frontend the user interacts with the debugger to select the program that will be debugged, to specify different options and to monitor the execution of the program. Debugging commands may be sent to one, all or a subset of the MPI processes.
Before the parallel debugger ddt can be used, it is necessary to load the corresponding module file:
$ module use /opt/bwhpc/ka/modulefiles      (only available for employees of KIT)
$ module add debugger/ddt
Now ddt may be started with the command
$ ddt program
where program is the name of your program that you want to debug.
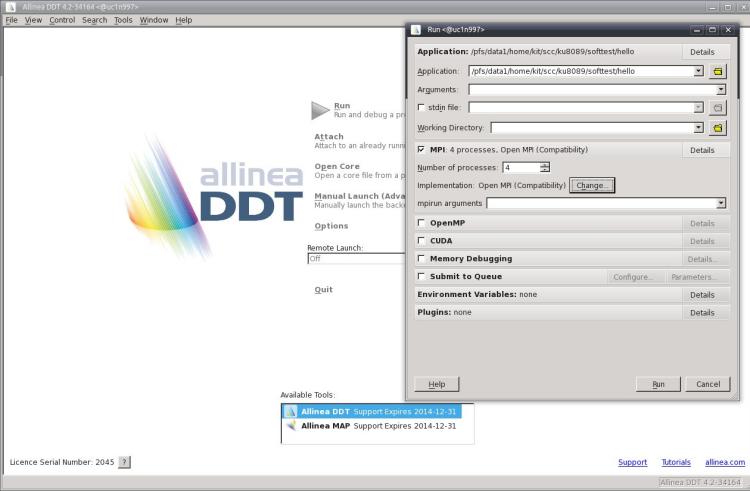
Figure: DDT startup window
The above figure shows ddt’s startup window. Before actually starting the debugging session you should check the contents of several fields in this window:
1. The top line shows the executable file that will be run under control of the debugger. In the following lines you may input some options that are passed to your program or to the MPI environment.
2. If your program reads data from stdin you can specify an input file in the startup window.
3. Before starting an MPI program you should check that "Open MPI (Compatability)" or "Intel MPI" is the MPI implementation that has been selected. If this is not the case, you have to change this. Otherwise ddt may not be able to run your program. In order to debug serial programs, the selected MPI implementation should be "none". You may also change the underlying serial debugger using the "change" button. By default ddt uses its own serial debugger, but it may also use the Intel idb debugger.
4. Select the number of MPI processes that will be started by ddt. If you are using ddt within a batch job, replace mpirun by ddt in the command line of ????? and make sure that the chosen number of MPI processes is identical to the number of MPI tasks (-p option ???) that you selected with the ?????? command. When you debug a serial program, select 1.
5. After you have checked all inputs in the ddt startup window, you can start the debugging session by pressing the "run" button.
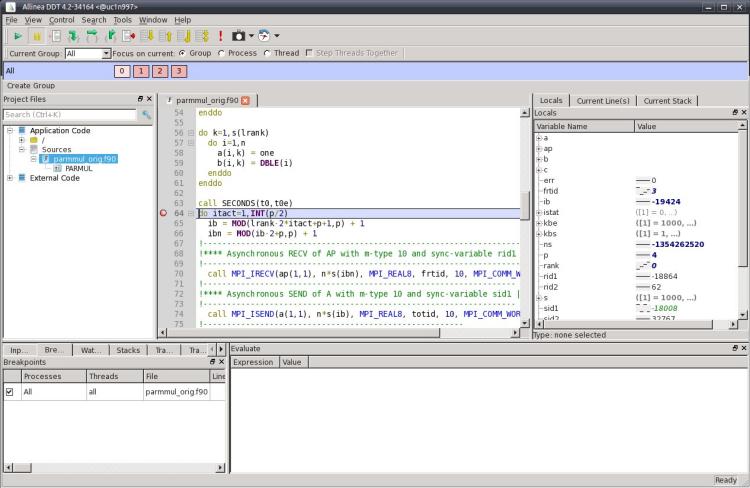
The ddt window now shows the source code of the program that is being debugged and breakpoints can be set by just pointing to the corresponding line and pressing the right
mouse button. So you may step through your program, display the values of variables
and arrays and look at the message queues.

