Development/Intel Compiler
| Description | Content |
|---|---|
| module load | compiler/intel |
| License | Commercial. See $INTEL_HOME/install-doc/EULA.txt. | Intel Product Licensig FAQ |
| Citing | n/a |
| Links | Intel C-Compiler Homepage |
| Graphical Interface | Yes (Intel Debugger GUI-Verison) |
| Included modules | icc | icpc | ifort | idb | gdb-ia |
Introduction
The Intel Compiler of the Intel Composer XE Suite consists of tools to compile and debug C, C++ and Fortran programs:
| icc | Intel C compiler |
| icpc | Intel C++ compiler |
| ifort | Intel Fortran compiler |
| idb | Intel debugger in GUI mode (until version 14 only) |
| gdb-ia | Intel version of GNU debugger in console mode (from version 15) |
| idbc | Intel debugger in console mode (until version 14 only) |
The intel compiler suite also includes the TBB (Threading Building Blocks) and IPP (Integrated Performance Primitives) libraries.
More information about the MPI versions of the Intel Compiler is available here:
Versions and Availability
A list of versions currently available on all bwHPC Clusters can be obtained from the cluster information system
Cluster Information System
On the command line interface of any bwHPC cluster you'll get a list of available versions by executing:
$ module avail compiler/intel
Loading the module
Default Version
You can load the default version of the Intel Compiler with the command
$ module load compiler/intel
If loading the module fails, check if you have already loaded the module
with 'module list'.
Specific (newer or older) Version
If you wish to load a specific (older or newer) version (if available), add the specific version number of the intel compiler, e.g. for loading Intel compiler suite 14.0, execute:
$ module unload compiler/intel
$ module   load compiler/intel/14.0
Note: Only one compiler can be loaded in your active session, hence, before loading a new intel compiler version you must to unload the current loaded version.
For unloading the intel compiler the version number is not required:
$ module unload compiler/intel
unloads any currently loaded intel compiler version.
Intel Compiler Specific Environment Variables
To see a list of all Intel Compiler environment variables set by the 'module load' command execute:
module show compiler/intel
Documentation
Online documentation
Local documentation
For version specific documentation see the help page of the module. For example
$ module help compiler/intel
will show the information for the default version.
Manual Pages
For detailed lists of the different program options consult the particular man page
$ man icc
$ man icpc
$ man ifort
$ man idb
$ man gdb-ia
Debugger
GUI
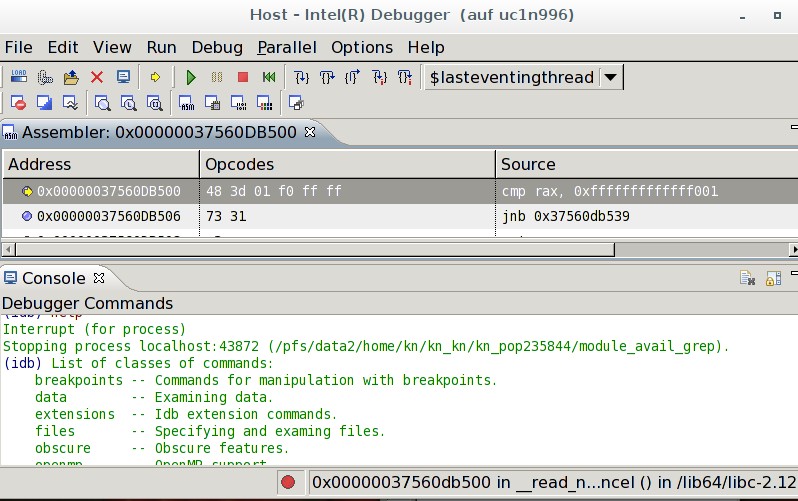
The Intel Debugger is an Eclipse Rich Client Platform based GUI driven Debugger with exciting features for parallelism and threading.
Start the GUI-debugger with the command 'idb [binary-file-name] &'.

Console Mode
Intel Debugger
The console-mode Intel debugger will be started using the command 'idbc [binary-file]'.
idbc module_avail_grep
Intel(R) Debugger for applications running on Intel(R) 64, Version 13.0, Build [80.483.23]
------------------
object file name: module_avail_grep
Reading symbols from /pfs/data2/home/kn/kn_kn/kn_pop235844/module_avail_grep...done.
(idb) help
List of classes of commands:

    breakpoints -- Commands for manipulation with breakpoints.
    data        -- Examining data.
    extensions  -- Idb extension commands.
    files       -- Specifying and examing files.
    obscure     -- Obscure features.
    openmp      -- OpenMP support.
    parallel    -- MPI support.
    running     -- Running the program.
    stack       -- Examining the stack.
    status      -- Status inquiries.
    support     -- Support facilities.

To display help on a particular command, enter "help" followed by the command
name. Command name abbreviations are allowed if unambiguous.
GNU for Intel Debugger
To debug applications natively on IA-32 or Intel64 Architecture systems, you may also use GDB with the following command: 'gdb-ia'.
The actual debugger usage is the same as for the GNU Project Debugger. Extensions for IA-32/Intel 64Architecture are described in the debugger documentation.
$ gdb-ia ./structure
[...]
GNU gdb (GDB) 7.5-1.0.81
Copyright (C) 2012 Free Software Foundation, Inc; (C) 2013-2014 Intel Corp.
License GPLv3+: GNU GPL version 3 or later <http://gnu.org/licenses/gpl.html>
This is free software: you are free to change and redistribute it.
There is NO WARRANTY, to the extent permitted by law.  Type "show copying"
and "show warranty" for details.
This GDB was configured as "x86_64-unknown-linux-gnu".
For information about how to find Technical Support, Product Updates,
User Forums, FAQs, tips and tricks, and other support information, please visit:
<http://www.intel.com/software/products/support/>...
Reading symbols from /pfs/data1/software_uc1/bwhpc/common/bio/structure/2.3.4/console/structure...done.
[...]
(gdb)
Optimizations
You can turn on various optimization options to enhance the performance of your program. Which options are the best depends on the specific program and can be determined by benchmarking your code. A command which gives good performance and a decent file size is
icc -xHost -O2 ex.c.
There are more aggressive optimization flags and levels (e.g. -O3 or -fast and implied options) but the compiled programs can get quite large due to inlining. Additionally the compilation process will probably take longer. Moreover it may happen that the compiled program is even slower -- or may require installation of additional statically-linked libraries. Such a command would be for example:
icc -fast ex.c
Profiling
Profiling an application means augmenting the compiled binary with information on execution counts per source-line (and basic blocks) -- e.g. one may see how many times an if-statement has been evaluated to true. To do so, compile your code with the profile flag:
icc -p ex.c -o ex.
Using the gprof tool, one may manually inspect execution count of each executed line of source code.
For compiler optimization, recompile Your source using
icc -prof-gen ex.c -o ex
then execute the most co]]mmon and typical use-case of your application, and then recompile using the generated profile count (and using optimization):
icc -prof-use -O2 ex.c -o ex.
Further literature
A tutorial on optimization can be found at Compiler-Essentials.pdf
and to get the different optimization options execute
icc -help opt
icc -help advanced
or the previously described catch-all option -v --help.