Development/Vampir and VampirServer: Difference between revisions
(Update description on running remote VampirServer) |
S Richling (talk | contribs) No edit summary |
||
| (30 intermediate revisions by 4 users not shown) | |||
| Line 1: | Line 1: | ||
{{Softwarepage|devel/vampir}} |
|||
{| width=600px class="wikitable" |
{| width=600px class="wikitable" |
||
|- |
|- |
||
| Line 5: | Line 7: | ||
| module load |
| module load |
||
| devel/vampir |
| devel/vampir |
||
|- |
|||
| Availability |
|||
| [[bwUniCluster]] | [[BwForCluster_Chemistry]] |
|||
|- |
|- |
||
| License |
| License |
||
| |
| Vampir Professional License |
||
|- |
|- |
||
|Citing |
|Citing |
||
| Line 22: | Line 21: | ||
|- |
|- |
||
| Included modules |
| Included modules |
||
| system compiler, available Open MPI |
|||
|- |
|||
|} |
|} |
||
<br> |
<br> |
||
| Line 28: | Line 27: | ||
Vampir and VampirServer are performance analysis tools developed at the Technical University of Dresden. With support from the Ministerium für Wissenschaft, Forschung und Kunst (MWK), |
Vampir and VampirServer are performance analysis tools developed at the Technical University of Dresden. With support from the Ministerium für Wissenschaft, Forschung und Kunst (MWK), |
||
all Universities participating in bwHPC (see [[bwUniCluster_2.0]]) have acquired a five year license. |
all Universities participating in bwHPC (see [[bwUniCluster_2.0]]) have acquired a five year license. |
||
<br> |
|||
If You want to make usage of a local installation as described in [[#Running Vampir GUI locally with parallel VampirServer|the section below]], please contact your Universities local compute center or by mail to [mailto:cluster-support@hs-esslingen.de cluster-support@hs-esslingen.de]. |
|||
= Versions and Availability = |
|||
A list of versions currently available on all bwHPC Clusters can be obtained from the |
|||
<br> |
<br> |
||
<big> |
|||
[https://cis-hpc.uni-konstanz.de/prod.cis/ Cluster Information System CIS] |
|||
</big> |
|||
{{#widget:Iframe |
|||
| url=https://cis-hpc.uni-konstanz.de/prod.cis/bwUniCluster/devel/vampir |
|||
| width=99% |
|||
| height=120 |
|||
}} |
|||
= Versions and Availability = |
|||
On the command line please check for availability using <kbd>module avail devel/vampir</kbd>. |
|||
Vampir provides the GUI and allows analyzing traces of a few hundred Megabytes. For larger traces, you may want |
Vampir provides the GUI and allows analyzing traces of a few hundred Megabytes. For larger traces, you may want |
||
to revert to using a remote VampirServer running in parallel on the compute nodes via a Batch script (see below). |
to revert to using a remote VampirServer running in parallel on the compute nodes via a Batch script (see below). |
||
Application traces consist of information gathered on the clusters prior to running Vampir |
Application traces consist of information gathered on the clusters prior to running Vampir |
||
using VampirTrace or [[Score-P]] and include timing, MPI communication, MPI I/O, hardware performance counters |
using VampirTrace or [[Development/Score-P|Score-P]] and include timing, MPI communication, MPI I/O, hardware performance counters |
||
and CUDA / OpenCL profiling (if enabled in the tracing library). |
and CUDA / OpenCL profiling (if enabled in the tracing library). |
||
| Line 54: | Line 43: | ||
$ module avail devel/vampir |
$ module avail devel/vampir |
||
------------------------ /opt/bwhpc/common/modulefiles/Core ------------------------- |
------------------------ /opt/bwhpc/common/modulefiles/Core ------------------------- |
||
devel/vampir/ |
devel/vampir/10.0</pre> |
||
<font color=red>Attention!</font><br> |
<font color=red>Attention!</font><br> |
||
Do not run <kbd>vampir</kbd> on the head nodes with large traces with many analysis processes for a long period of time. |
Do not run <kbd>vampir</kbd> or <kbd>vampirserver</kbd> on the head nodes with large traces with many analysis processes for a long period of time. |
||
Instead use one of the possibilities listed below. |
|||
<br> |
|||
<font color=red>Please note:</font><br> |
|||
Please use on of the possibilities listed below. |
|||
The <kbd>vampirserver</kbd> v10.0 protocol is not compatible to Vampir v9.x GUI, i.e. you will need to install matching versions on your |
|||
local work-place PC. Please contact your computer center for installation files. |
|||
<br> |
<br> |
||
= Tutorial = |
= Tutorial = |
||
| Line 67: | Line 59: | ||
provides Manuals in the <kbd>$VAMPIR_DOC_DIR</kbd> directory. |
provides Manuals in the <kbd>$VAMPIR_DOC_DIR</kbd> directory. |
||
Prior to analyzing your application, You need to compile and link with [[Development/Score-P|Score-P]]. |
|||
== Running Vampir GUI == |
|||
Running Vampir GUI and VampirServer is possible in various way as highlighted in the following images: |
Running Vampir GUI and VampirServer is possible in various way as highlighted in the following images: |
||
[[File:vampir_head_node.png|thumb|Vampir GUI running on the login node]] |
|||
This is the simplest of all setups: You have to log in using X11 forwarding, by ticking the box in Putty, or passing <kbd>-X</kbd> or <kbd>-Y</kbd> to Your SSH line when logging in. Please check whether Your X11 forwarding has been setup and working by checking the <kbd>$DISPLAY</kbd> variable. For example run: |
|||
<pre> |
|||
workstation$ ssh -Y user@bwunicluster.scc.kit.edu |
|||
bwunicluster$ echo $DISPLAY |
|||
10.0.3.229:20.0 |
|||
bwunicluster$ xdvi # If the window pops up, You're good to go |
|||
bwunicluster$ module load devel/vampir |
|||
bwunicluster$ vampir # Starting the Qt Application Vampir GUI |
|||
</pre> |
|||
'''Please note:''' |
|||
<br> |
|||
* That You shouldn't run time-consuming, long-running tasks requiring lots of memory on the login nodes. |
|||
* Please see the net step of running additionally VampirServer |
|||
* As always performance is best, if Your trace files are available on a parallel filesystem, not on NFS. |
|||
== Running Vampir GUI with parallel VampirServer == |
|||
[[File:vampir_parallel.png|thumb|Vampir GUI plus VampirServer]] |
|||
In addition to the previous setup, You start a batch job to do the heavy lifting of analyzing large trace files employing the VampirServer. |
|||
<pre> |
|||
bwunicluster$ module load devel/vampir |
|||
bwunicluster$ vampirserver start -- -t 60 |
|||
Launching VampirServer... |
|||
Submitting slurm 60 minutes job (this might take a while)... |
|||
</pre> |
|||
Please note that this submits a minimal batch allocation to queue <kbd>multiple</kbd>. |
|||
Since this may take considerable amount to start (like 10 minutes to an hour), start another batch job mainly aimed at testing and developing: |
|||
<pre> |
|||
bwunicluster$ vampirserver start -- -t 30 -- --partition=dev_multiple |
|||
Launching VampirServer... |
|||
Submitting slurm 30 minutes job (this might take a while)... |
|||
salloc: Pending job allocation 19393903 |
|||
salloc: job 1234 queued and waiting for resources |
|||
salloc: job 1234 has been allocated resources |
|||
salloc: Granted job allocation 1234 |
|||
salloc: Waiting for resource configuration |
|||
salloc: Nodes uc2n[001-002] are ready for job |
|||
VampirServer 9.10.0 (5886afc1) |
|||
Licensed to Universitäten und Hochschulen Baden-Württemberg |
|||
Running 4 analysis processes... (abort with vampirserver stop 567) |
|||
VampirServer <567> listens on: uc2n001.localdomain:30000 |
|||
</pre> |
|||
The maximum amount of time is 30 minutes in this queue (on bwUniCluster check [[BwUniCluster_2.0_Batch_Queues]]). |
|||
Then start <kbd>vampir</kbd> and connect to the nodes and the port -- and browse to your trace file. |
|||
'''Please note:''' |
|||
* You may list running VampirServer using <kbd>vampirserver ls</kbd>, |
|||
* You may now connect to the VampirServer from the Vampir GUI using the above node <kbd>uc2n001</kbd> and port <kbd>30000</kbd>, |
|||
* Having trace files stored on the compute nodes SSDs may help performance '''if they already''' are there; otherwise VampirServer will load trace files in memory from the file system upon receiving the load-command from Vampir GUI, |
|||
* Disconnecting from a remote VampirServer does not quit or cancel the batch job, |
|||
* In case Your VampirServer batch job runs out of time, You'll receive a "connetion closed" failure in Vampir GUI, |
|||
* Please '''free''' resources of a running VampirServer using <kbd>scancel 1234</kbd> if finished, |
|||
* More information on VampirServer is provided in the below section. |
|||
== Running Vampir GUI locally with parallel VampirServer == |
|||
[[File:vampir_parallel_remote.png|thumb|Vampir GUI locally, connecting to VampirServer]] |
|||
The previous setups may have latency issues when connecting over slow network connections and VPN. |
|||
An alternative is to use a <kbd>vampir-proxy</kbd> service on the head node and installing Vampir GUI locally on your work PC |
|||
(see notes below). |
|||
<pre> |
|||
bwunicluster$ module load devel/vampir |
|||
bwunicluster$ sbatch --time=02:00:00 $VAMPIR_HOME/vampirserver.slurm |
|||
Submitted batch job 1234 |
|||
</pre> |
|||
Please check the <kbd>slurm-1234.txt</kbd> output file for the started node and '''port''' information. |
|||
Now, You start a ssh-proxy to the bwHPC machine, e.g. |
|||
<pre> |
|||
bwunicluster$ tail -F slurm-1234.txt |
|||
Running VampirServer with 2 nodes and 39 tasks. |
|||
... |
|||
Server listens on: uc2n123.localdomain:30000 |
|||
# Hit CTRL^C on the tail command |
|||
# Open another terminal on Your workstation: |
|||
workstation$ ssh -L30000:uc2n123:30000 MY_LOGIN@bwunicluster.scc.kit.edu |
|||
# Enter OTP and password information -- as long as this shell is logged in, your port is being forwarded to the compute node. |
|||
</pre> |
|||
Now, You may open Vampir GUI on your local installation and connect remotely to host <kbd>localhost</kbd> and port <kbd>30000</kbd>. |
|||
On Linux and MacOS you may verify the opened port using <kbd>netstat -nat | grep 30000</kbd>. |
|||
'''Please note:''' |
|||
* Vampir is available to employees of the Universities and HAWs participating in bwHPC, i.e only in the state-of Baden-Württemberg, you may not install this on private PCs (please contact your compute center), |
|||
* As always, there may be networking issues (VPN, Firewall, connectivity), which require assistance from your compute center. |
|||
* If the port is not available your ssh connection may silently die. |
|||
* The tool <kbd>vampir-proxy</kbd> does the same as <kbd>ssh</kbd>, however is not available e.g. on MacOS or Windows. |
|||
* Depending on your local Qt configuration like "Dark mode", the output may be obfuscated, e.g. showing MPI messages as white lines... |
|||
== How to navigate Vampir GUI == |
|||
This section is by no means a complete tutorial, however one may follow the general concepts by tracing one's application using [[Development/Score-P|Score-P]] or by downloading the [https://vampir.eu/public/files/tracefiles/Large_Score-P.zip Large Scale Score-P WRF trace]. |
|||
[[File:vampirscreen.png|896px|frame|Vampir Screen using Dark Mode]] |
|||
This screen shot shows Vampir GUI's Qt in Dark Mode on MacOS. |
|||
After loading the trace file, we see the main Timeline showing 8 processes w/o Threads '''(1)''' and the Function Summary '''(4)'''. |
|||
We may add a Process timeline '''(2)''' (here for Process 0) which shows the calling stack of the trace, aka <kbd>MAIN_</kbd> calls into <kbd>module_wrf_top_mp</kbd> which itselve calls into the most time-consuming function <kbd>solve_em_</kbd> (overall 116.147 seconds accumulated exclusive time over all processes of 82.52 seconds runtime). |
|||
Using <kbd>Vampir-->Preferences-->Appearance</kbd> one may color the most time-consuming functions in different color to highlight the evolution of the trace (e.g. <kbd>module_wrf_top_mp_wrf_init_</kbd> as pink). |
|||
Next, zoom into the timeline anywhere and check the Communication Matrix View '''(5)''' setting e.g. the average Message Size being sent and received. At our zoom-level we see messages are sent nearest neighbor and above (a 2D code?) with 30 KiB to 60 KiB average message size (which is good, but message size differs among processes). |
|||
Next we may add a System Tree '''(6)''' selecting one of the PAPI's CPU counters collected in this trace, here the Floating Point operations per second. As we may see, MPI rank 1 has considerably less FP operations to compute compared to MPI rank 0 and 2. There may be a load-imbalance. |
|||
We may add the process-relevant metrics in '''(3)''' to compare, where this happens (adjusting the Y-scale using right-click <kbd>Options</kbd> and setting both to 2,0e9) -- however in this Zoom-level, there is no obvious difference. |
|||
<br> |
|||
= Running remote VampirServer = |
= Running remote VampirServer = |
||
| Line 130: | Line 224: | ||
| Print VampirServer's revision |
| Print VampirServer's revision |
||
|} |
|} |
||
[[Category:performance analysis software]][[Category:bwUniCluster]] |
|||
Latest revision as of 00:58, 9 December 2022
|
The main documentation is available via |
| Description | Content |
|---|---|
| module load | devel/vampir |
| License | Vampir Professional License |
| Citing | n/a |
| Links | Homepage | Tutorial | Use case |
| Graphical Interface | Yes |
| Included modules | system compiler, available Open MPI |
Introduction
Vampir and VampirServer are performance analysis tools developed at the Technical University of Dresden. With support from the Ministerium für Wissenschaft, Forschung und Kunst (MWK), all Universities participating in bwHPC (see bwUniCluster_2.0) have acquired a five year license.
If You want to make usage of a local installation as described in the section below, please contact your Universities local compute center or by mail to cluster-support@hs-esslingen.de.
Versions and Availability
Vampir provides the GUI and allows analyzing traces of a few hundred Megabytes. For larger traces, you may want to revert to using a remote VampirServer running in parallel on the compute nodes via a Batch script (see below).
Application traces consist of information gathered on the clusters prior to running Vampir using VampirTrace or Score-P and include timing, MPI communication, MPI I/O, hardware performance counters and CUDA / OpenCL profiling (if enabled in the tracing library).
$ : bwUniCluster 2.0
$ module avail devel/vampir
------------------------ /opt/bwhpc/common/modulefiles/Core -------------------------
devel/vampir/10.0
Attention!
Do not run vampir or vampirserver on the head nodes with large traces with many analysis processes for a long period of time.
Instead use one of the possibilities listed below.
Please note:
The vampirserver v10.0 protocol is not compatible to Vampir v9.x GUI, i.e. you will need to install matching versions on your
local work-place PC. Please contact your computer center for installation files.
Tutorial
For online documentation see the links section in the summary table at the top of this page. The local installation provides Manuals in the $VAMPIR_DOC_DIR directory.
Prior to analyzing your application, You need to compile and link with Score-P.
Running Vampir GUI
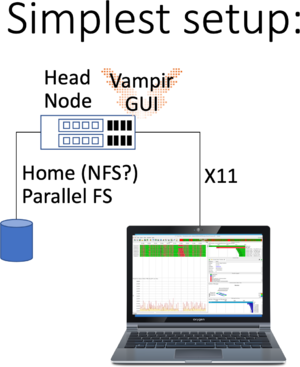
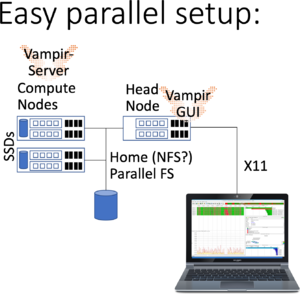
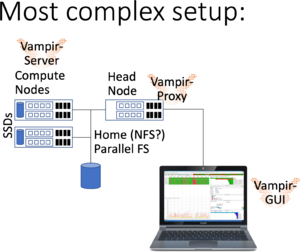
Running Vampir GUI and VampirServer is possible in various way as highlighted in the following images:
This is the simplest of all setups: You have to log in using X11 forwarding, by ticking the box in Putty, or passing -X or -Y to Your SSH line when logging in. Please check whether Your X11 forwarding has been setup and working by checking the $DISPLAY variable. For example run:
workstation$ ssh -Y user@bwunicluster.scc.kit.edu
bwunicluster$ echo $DISPLAY
10.0.3.229:20.0
bwunicluster$ xdvi     # If the window pops up, You're good to go
bwunicluster$ module load devel/vampir
bwunicluster$ vampir   # Starting the Qt Application Vampir GUI
Please note:
- That You shouldn't run time-consuming, long-running tasks requiring lots of memory on the login nodes.
- Please see the net step of running additionally VampirServer
- As always performance is best, if Your trace files are available on a parallel filesystem, not on NFS.
Running Vampir GUI with parallel VampirServer
In addition to the previous setup, You start a batch job to do the heavy lifting of analyzing large trace files employing the VampirServer.
bwunicluster$ module load devel/vampir
bwunicluster$ vampirserver start -- -t 60
Launching VampirServer...
Submitting slurm 60 minutes job (this might take a while)...
Please note that this submits a minimal batch allocation to queue multiple. Since this may take considerable amount to start (like 10 minutes to an hour), start another batch job mainly aimed at testing and developing:
bwunicluster$ vampirserver start -- -t 30 -- --partition=dev_multiple
Launching VampirServer...
Submitting slurm 30 minutes job (this might take a while)...
salloc: Pending job allocation 19393903
salloc: job 1234 queued and waiting for resources
salloc: job 1234 has been allocated resources
salloc: Granted job allocation 1234
salloc: Waiting for resource configuration
salloc: Nodes uc2n[001-002] are ready for job
VampirServer 9.10.0  (5886afc1)
Licensed to Universitäten und Hochschulen Baden-Württemberg
Running 4 analysis processes... (abort with vampirserver stop 567)
VampirServer <567> listens on: uc2n001.localdomain:30000
The maximum amount of time is 30 minutes in this queue (on bwUniCluster check BwUniCluster_2.0_Batch_Queues). Then start vampir and connect to the nodes and the port -- and browse to your trace file.
Please note:
- You may list running VampirServer using vampirserver ls,
- You may now connect to the VampirServer from the Vampir GUI using the above node uc2n001 and port 30000,
- Having trace files stored on the compute nodes SSDs may help performance if they already are there; otherwise VampirServer will load trace files in memory from the file system upon receiving the load-command from Vampir GUI,
- Disconnecting from a remote VampirServer does not quit or cancel the batch job,
- In case Your VampirServer batch job runs out of time, You'll receive a "connetion closed" failure in Vampir GUI,
- Please free resources of a running VampirServer using scancel 1234 if finished,
- More information on VampirServer is provided in the below section.
Running Vampir GUI locally with parallel VampirServer
The previous setups may have latency issues when connecting over slow network connections and VPN. An alternative is to use a vampir-proxy service on the head node and installing Vampir GUI locally on your work PC (see notes below).
bwunicluster$ module load devel/vampir
bwunicluster$ sbatch --time=02:00:00 $VAMPIR_HOME/vampirserver.slurm
Submitted batch job 1234
Please check the slurm-1234.txt output file for the started node and port information. Now, You start a ssh-proxy to the bwHPC machine, e.g.
bwunicluster$ tail -F slurm-1234.txt
Running VampirServer with 2 nodes and 39 tasks.
...
Server listens on: uc2n123.localdomain:30000
# Hit CTRL^C on the tail command

# Open another terminal on Your workstation:
workstation$ ssh -L30000:uc2n123:30000 MY_LOGIN@bwunicluster.scc.kit.edu
# Enter OTP and password information -- as long as this shell is logged in, your port is being forwarded to the compute node.
Now, You may open Vampir GUI on your local installation and connect remotely to host localhost and port 30000. On Linux and MacOS you may verify the opened port using netstat -nat | grep 30000.
Please note:
- Vampir is available to employees of the Universities and HAWs participating in bwHPC, i.e only in the state-of Baden-Württemberg, you may not install this on private PCs (please contact your compute center),
- As always, there may be networking issues (VPN, Firewall, connectivity), which require assistance from your compute center.
- If the port is not available your ssh connection may silently die.
- The tool vampir-proxy does the same as ssh, however is not available e.g. on MacOS or Windows.
- Depending on your local Qt configuration like "Dark mode", the output may be obfuscated, e.g. showing MPI messages as white lines...
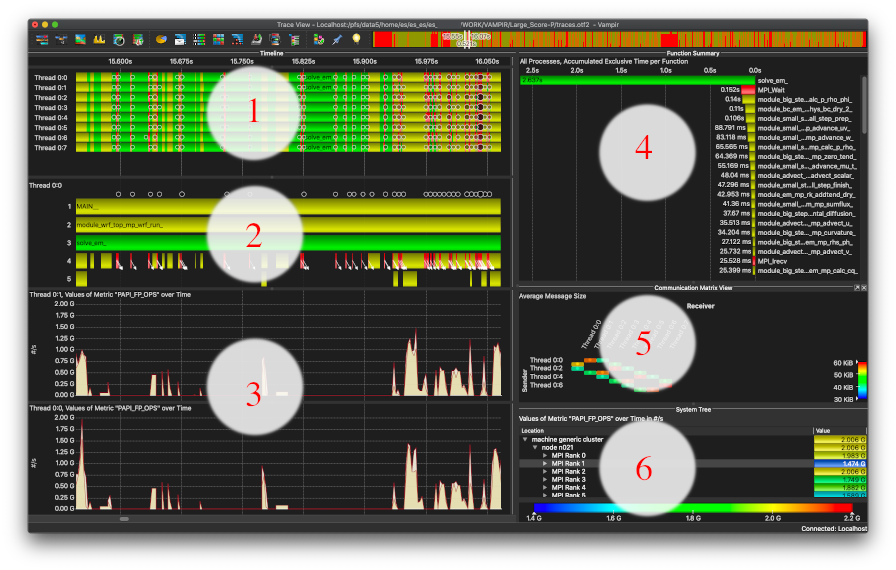
This section is by no means a complete tutorial, however one may follow the general concepts by tracing one's application using Score-P or by downloading the Large Scale Score-P WRF trace.
This screen shot shows Vampir GUI's Qt in Dark Mode on MacOS. After loading the trace file, we see the main Timeline showing 8 processes w/o Threads (1) and the Function Summary (4). We may add a Process timeline (2) (here for Process 0) which shows the calling stack of the trace, aka MAIN_ calls into module_wrf_top_mp which itselve calls into the most time-consuming function solve_em_ (overall 116.147 seconds accumulated exclusive time over all processes of 82.52 seconds runtime). Using Vampir-->Preferences-->Appearance one may color the most time-consuming functions in different color to highlight the evolution of the trace (e.g. module_wrf_top_mp_wrf_init_ as pink).
Next, zoom into the timeline anywhere and check the Communication Matrix View (5) setting e.g. the average Message Size being sent and received. At our zoom-level we see messages are sent nearest neighbor and above (a 2D code?) with 30 KiB to 60 KiB average message size (which is good, but message size differs among processes).
Next we may add a System Tree (6) selecting one of the PAPI's CPU counters collected in this trace, here the Floating Point operations per second. As we may see, MPI rank 1 has considerably less FP operations to compute compared to MPI rank 0 and 2. There may be a load-imbalance.
We may add the process-relevant metrics in (3) to compare, where this happens (adjusting the Y-scale using right-click Options and setting both to 2,0e9) -- however in this Zoom-level, there is no obvious difference.
Running remote VampirServer
The installation provides in $VAMPIR_HOME a SLURM batch script with which You may run parallel VampirServer instance on the compute nodes. You may attach to your VampirServer node using the provided port (typically port 30000, please check in the SLURM output file, once started). The SLURM script only supplies the queue name (default multiple); if You expect Your analysis to run for only 30 minutes or less, you may want to use another Queue meant for short-running development purposes dev_multiple which on bwUniCluster allows specifying the maximum time:
sbatch --partition=dev_multiple --time=30 $VAMPIR_HOME/vampirserver.slurm
Meanwhile, you may want to start another job using the default multiple queue; so that it will be scheduled, once your first job runs out.
Please query using squeue on the current status of both jobs and check the relevant SLURM output files.
VampirServer commands
If You want to run VampirServer as part of Your job-script, e.g. after finalizing Your application's run, add the following to your Batch script:
module load devel/vampir
vampirserver start mpi
This shell scripts starts the MPI-parallel version of the VampirServer in the existing, already running SLURM job. The results of starting VampirServer is stored in $HOME/.vampir/server/list; you may check using the below commands, or by checking this file directly.
15 1604424211 mpi 20 uc2n001.localdomain 30000 2178460
Where the first column is the server number (incremented), the third column is the parallelisation mode VAMPIR_MODE, the next column is the number of tasks, followed by the name of the node (uc2n001) and the port (30000).
The commands available to the vampirserver shell script are
| Command | Description |
|---|---|
| help | Show this help |
| config | Interactively configure VampirServer for the given host system. |
| list | List running servers including hostname and port (see file $HOME/.vampir/server/list). |
| start [-t NUM] [LAUNCHER] | Starts a new VampirServer, using -t number of seconds with LAUNCHER being either smp (default), mpi and ap (Cray/HPE only) |
| stop [SERVER_ID] | Stops the specified server again |
| version | Print VampirServer's revision |


